
Donald Trump sure has a strange approach to making housing more “affordable”. He apparently wants lower costs for buyers and higher prices for owners and sellers!
“I don’t want to drive housing prices down. I want to drive housing prices up for people who own their homes.”
Needless to say, as the Donald’s scrambles about seeking housing affordability “solutions”, we’d rather suspect that higher house prices are not quite what the economic doctor ordered. That is to say, during the last 55 years the number of hours an average worker needed to put on the clock in order to afford a median price US home has doubled—rising from 7,000 hours in 1963 to more than 14,000 hours or seven standard work-years worth of earnings in 2025.
Accordingly, you can’t find a more graphic proof that Washington has been sending “affordability” reeling in the wrong direction for decades on end than what is depicted in the graph below. It cuts through the noise of the Fed’s inflated dollars, which are not even comparable from decade to decade, let alone over a half-century. Instead, it puts housing prices and the wages needed to purchase a home in the plain language of hours on the employer’s clock.
Yet after five decades of Washington hanging the carrot of homeownership farther and farther in front of the mule, the Donald proposes to push prices still higher. Apparently he believes that homeowners check the market value of their castles frequently and will therefore praise the man in the Oval Office whenever “the number go up”.
We’re not sure that’s even true as a political matter. That’s because the soaring prices of existing homes have been affordable only because mortgage rates were artificially suppressed for decades. But even that’s no longer always the case because literally tens of millions of homeowners who may need to move or want to trade-up are now locked into their existing houses: They simply can’t afford to abandon the super-low mortgage rates on their existing abode in favor of a new mortgage on a different home at current market rates (see below).
In any case, it’s just plain economic nonsense to think that the currently required 14,000 work hours to buy a median home is copacetic and that even higher home prices are just the ticket.
Number of Hours An Average Workers Needs To Purchase A Median Price Home
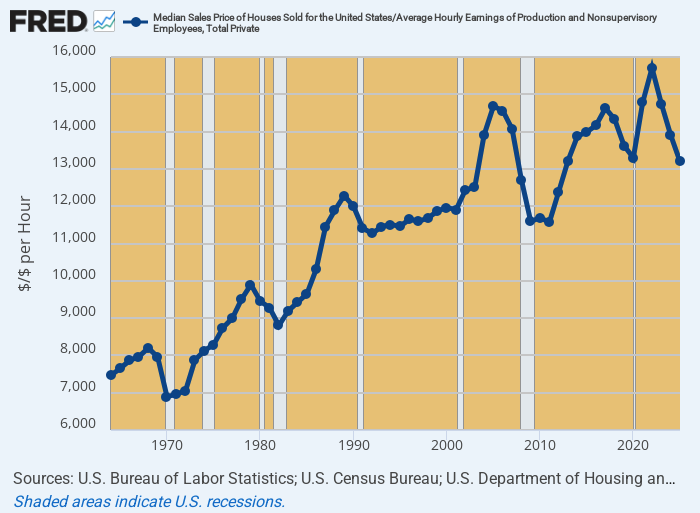
Actually, the relentlessly rising line in the graph above tells you all you need to know about the “affordability” issue. To wit, everywhere and always central bank money-printing causes asset prices to rise far faster than incomes, thereby inexorably shifting nominal societal wealth to asset holders and especially highly leveraged speculators.
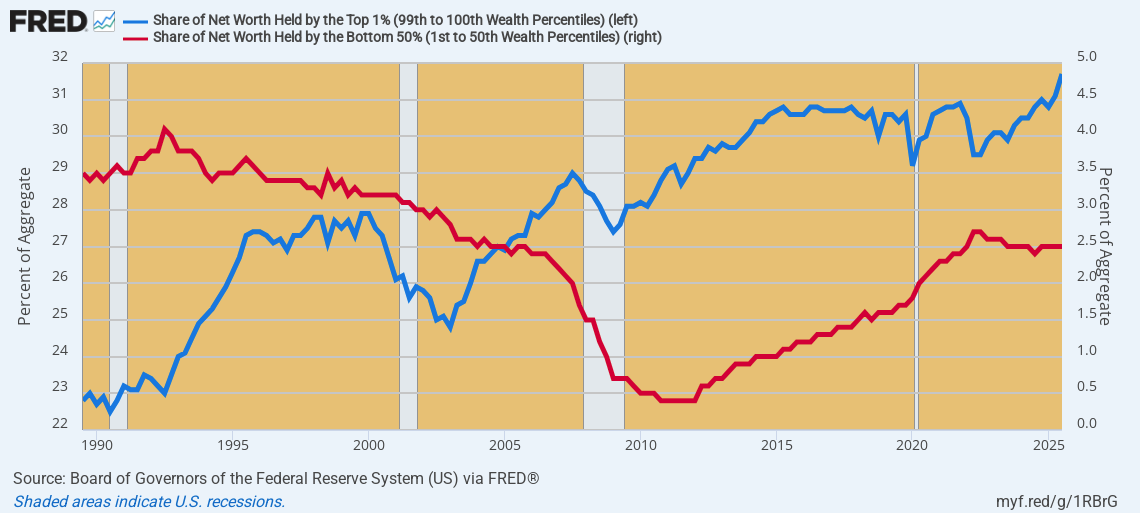
For want of doubt, here is the change in shares of net worth held by the top 1% of households (blue line) versus the bottom 50% (red line) between 1989 and 2025. There is absolutely no doubt that the Fed’s chronic and systematic inflation of asset prices—-both housing and financial instruments—-has massively and artificially shifted wealth to the tippy-top of the economic ladder.
Household Net Worth: Top 1% Versus Bottom 50%, 1989 to 2025
Moreover, the mechanism is straight-forward. The central bank’s only real policy tool is to print money and thereby drive interest rates to sub-economic levels. That’s supposed to induce households and businesses alike to borrow more and spend more in mechanically Keynesian fashion, thereby purportedly raising economic output and wealth above levels that the free market would generate on its own steam.
It doesn’t actually work that way, of course. That’s because of a modern version of the Cantillon Effect. The latter was the classic formulation correctly holding that newly printed money doesn’t have uniform effects upon economic actors, but instead benefits the first recipients—even as it penalizes money users in the subsequent, increasingly inflated transactions down the line.
Likewise, when today the Fed buys tens of billions of government debt in short periods, as it has done repeatedly for decades, the fiat credits first flow into Wall Street. There these newly minted credits are put to work in speculative purchases of equities and especially repo’d debt securities (i.e. 95% or higher leveraged purchases using the government bonds as collateral). Indeed, the so-called primary dealers are pleased to call these leveraged purchases inventory investments made in pursuit of their supposedly solemn obligation to make markets in Uncle Sam’s $30 trillion flood of debt paper.
Of course, these new central bank credits flowing into Wall Street actually result in an artificial bid for financial assets and therefore the systematic falsification of stock and bond prices. As it happens, of course, such artificial windfall gains from Fed-induced asset price inflation are held to be a just reward for an honest days work in the bond pits by traders and for occasionally glancing at the computer screen for homegamers.
Moreover, this is all justified as so-called “stimulus” for the greater good, and, at length, a portion of the new Fed credit flowing into Wall Street does eventually find its way to main street. There, one of the most potent channels of transmission is the residential housing market, where a whole array of state-sponsored institutions including the FHA, VA, Fannie Mae, Freddie Mac, Farmer’s Home Administration, the Home Loan Banks and sundry others provide mortgage insurance, debt guarantees and tax breaks designed to encourage the highly leveraged purchase of homes by tens of millions of households.
All of these so-called pro-ownership elements of Federal policy are aimed to subsidize homeownership in one way or another, but much of the implicit subsidy does not stick to the wallets, so to speak, of the intended beneficiaries. Instead, it ends up bidding up the price of housing units and especially the scarce land where they are located.
In effect, just like the Cantillon Effect holds, the original developers and/or builders capture much of the subsidy benefit, even as subsequent owners progressively capture smaller pieces of the so-called rents as Federal-subsidy enabled buyers continue to bid prices steadily higher in each subsequent round of home sales.
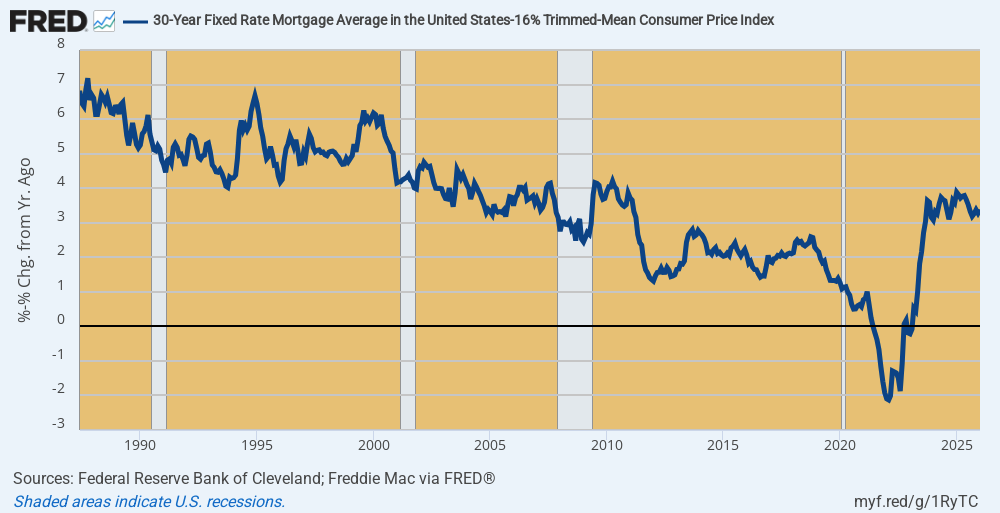
Needless to say, the huge subsidy implicit in the Fed’s suppression of long-term interest rates is the most potent of all government interventions in the residential housing market. The graph below shows the inflation-adjusted or “real” 30-year mortgage rate going back to June 1987, which was the eve of Alan Greenspan’s tenure as Fed Chairman and the onset of contemporary “wealth effects” central banking.
As is evident from the graph, the real mortgage rate marched steadily downhill for 35-years running. Over that span it dropped by a staggering 900 basis points—-from +700 on mid-1987 to -200 at the cycle bottom in early 2022.
This was supposedly for the benefit of buyers to help them afford more house at the same level of real income with each passing year. In reality, however, it mainly benefited sellers who received the windfall proceeds from leverage-inflated bids in the current sales market.
Alas, this untoward game of ever lower real carry costs of leveraged home ownership and ever higher housing asset prices was inexorably a one-time endeavor that eventually had to reach a breaking point. In fact, the real 30-year mortgage rate at -214 basis points in February 2022 was finally all she wrote. At that point, the inflationary genie was out of the bottle across the length and breadth of main street and the Fed was forced to pivot into fighting 40-year high goods and services inflation.
Unfortunately, the return of more sustainable real long-term mortgage rates—which have now settled in the +3.0% to +4.0% range—-is wreaking havoc with the homeownership market. Existing homeowners are not getting the real appreciation they had come to expect over decades and decades, while new buyers are getting stuck with far higher mortgage costs relative to incomes than has been the case since the 1970s.
Inflation-Adjusted 30-Year Home Mortgage Rate, 1987 to 2025
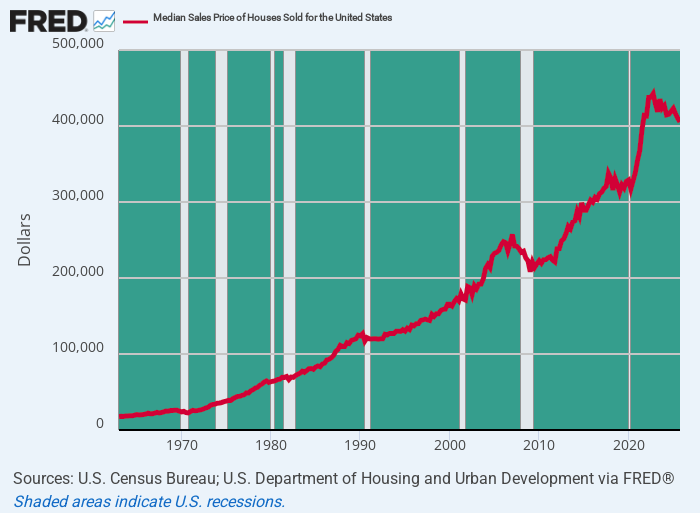
For want of doubt, here is the long-term trend in median home prices in the US, which historically marched relentlessly uphill, rising from $18,000 in 1963 to the early 2022 peak of $442,600. That represented a compound increase of nearly 5.5% per annum for nearly 60 years running.
The reason that the Donald is talking nonsense with respect to housing affordability, therefore, is that the Fed’s cheap money game is over. Since Q2 2022, the median home sales price has dropped by $27,000 or 6% in nominal terms and nearly 17% in real terms. That is to say, existing homeowners are no longer chanting “number go up”. Not by a long shot.
At the same time, new buyers are being hammered with far higher monthly mortgage costs, even as purchase prices have fallen. For instance, an 80% loan-to-value 30-year fixed rate mortgage in Q2 2022 would have generated annual interest expense of $19,960 on a median priced home. But despite the $27,000 decline in the median home price by Q2 2025, annual interest expense would have been +11.5% higher at $22,250.
In short, homeowners have been living in a dream world for decades, but now the Fed’s easy money chickens are coming home to roost:
- Existing home owners are suffering asset deflation for the first time in half a century.
- New Home Buyers are facing materially higher interest carry costs.
- Many recent home buyers are now locked-in because they can’t afford to roll over their mortgage to sharply higher rates.
Median Sales Price Of New Houses Sold In The US, 1963 to 2025
Needless to say, the burgeoning ranks of locked-in homeowners are nothing to sneeze about. As a practical matter, we do not see how the Fed will get the inflation rate much below 3% any time soon—nor is it in a position to buy-up enough GSE and US Treasury paper to drive the real long-term spread on top of inflation much below 3%, either.
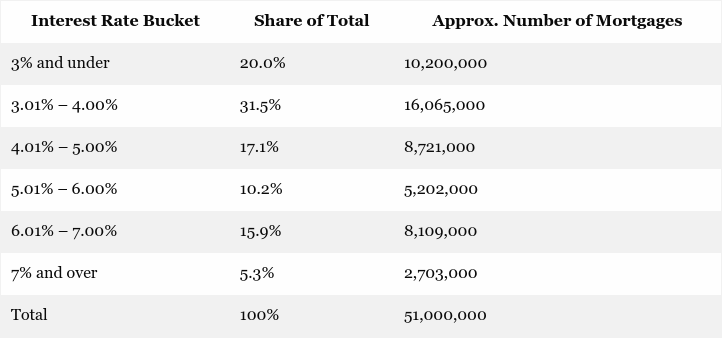
So as a practical matter, no one is going to see nominal 30-year mortgage rates below 5.0% any time soon. What that means is that there are now more than 10 million mortgages locked-in at deeply below market rates of 3.0% or under, while upwards of 25 million or nearly half of all home mortgages outstanding carry rates under 5.0%
In short, America’s great but essentially fraudulent, Fed-enabled housing refi machine is out of business after more than 30 years of generating windfall gains and extra dollops of cash to leveraged homeowners.
Now, in fact, it is likely to function in reverse: The overwhelming share of existing home mortgages will become what the bitcoin speculators erroneously deified as HODLs (hang on for dear life). That means, in turn, far less churn in the housing market as owners cling to aging low rate mortgages, while over time millions of maturing mortgages will be rolling over into higher rates—a phenomena not witnessed since the 1970s.
Stated differently, the Donald’s housing minions are actually grappling with something very new under the sun in the US home mortgage market: Namely, the huge share of home-buyers who have been immobilized by the necessity of staying put, keeping their low rates mortgages in place. Ironically, what that also means is that there will be far fewer “move-up” sellers on the market at any given time, thereby putting additional upward pressure on “starter” home availability and prices in the bottom ranges of the residential housing market.
In short, there is something to be said for honest, market-based interest rates that has been lost on the Fed for decades upon decades since 1987. To wit, dishonest Fed-engineered asset prices generated windfalls that were captured by several generations of sellers since 1987. But that was not sustainable and is now a thing of the past.
Indeed, the Fed’s far-from-over battle against excess inflation will mean higher mortgage carry costs and weaker—if not falling—housing prices for years to come. That’s surely the very opposite of what the Donald has in mind.
Distribution of Existing Home Mortgages By Interest Rate Interval
In short, if the Donald wants to make housing more affordable his only bet would be to desperately order the Fed to lurch back into massive US government bond purchases in order to drive down the 10-year UST yield and the home mortgage rates which price from it.
We doubt, of course, that Kevin Warsh will bend over, even upon an all caps middle of the night social media screed by the Donald. But even if he did, the White House would quickly face a crashing dollar and soaring main street inflation that might even make voters hanker for a return of Sleepy Joe.
Editor’s Note: The story here is simple: when money is made cheap on purpose, assets like houses get bid up—and regular incomes can’t keep up.
Now that higher, more normal interest rates are back, the “easy” years are over. Buyers face bigger monthly payments, sellers can’t count on endless price gains, and millions of homeowners are stuck in place because moving would mean trading a low-rate mortgage for a punishingly higher one.
In other words, this isn’t a short-term hiccup—it’s a new phase, and it can ripple far beyond housing into inflation, savings, and the strength of the dollar itself.
If you want to be prepared for what that kind of shift can trigger, we’ve put together a free PDF special report that lays it out in plain English—what happens if confidence in the dollar cracks, why governments tend to reach for heavier-handed policies when they’re boxed in, and the steps you can take to protect your money before those measures arrive. Click here to download the free PDF now.